
Lately I have had conversations with investors who can’t hold back from telling me how well their stocks have performed in recent years. I’m happy that they have done well but can’t overlook the time period that they are considering.
It is human nature to place more weight on recent trading performance than historical trading performance. I suspect most of us are guilty of that. Let’s bear in mind what happened five years ago this month by considering the following chart of the S&P 500.
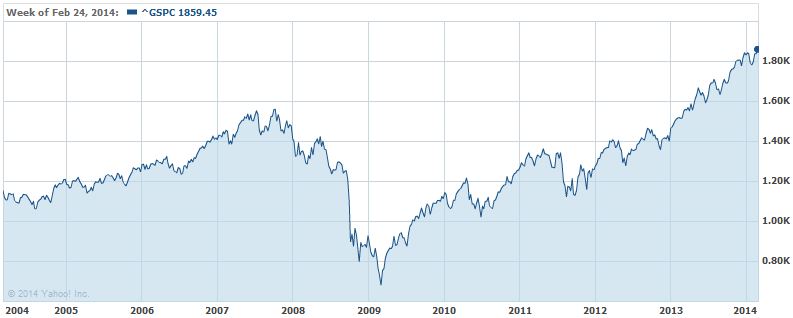
The S&P 500 hit a low in early March 2009 but then began a five-year bull run. From the low of March 2009 to now, the S&P 500 has achieved a compound annual growth rate (CAGR) of 21.4% which is incredible. The past five years have been a period in time where buying and holding SPY has worked very well but you must not confuse a bull market with brains.
Let’s look at two other time periods with the same endpoint, March 2014, to see how the S&P 500 has performed. For the seven-year period from March 01, 2007, to now, the S&P 500 has achieved a CAGR of 4.0%. For the ten-year period from March 01, 2004, to now, the S&P 500 has achieved a CAGR of 4.8%. Clearly, the past five years have been exceptional for the S&P 500 but, in my opinion, there is no possibility of a repeat performance for the next five years.
0 Comments