
June 01
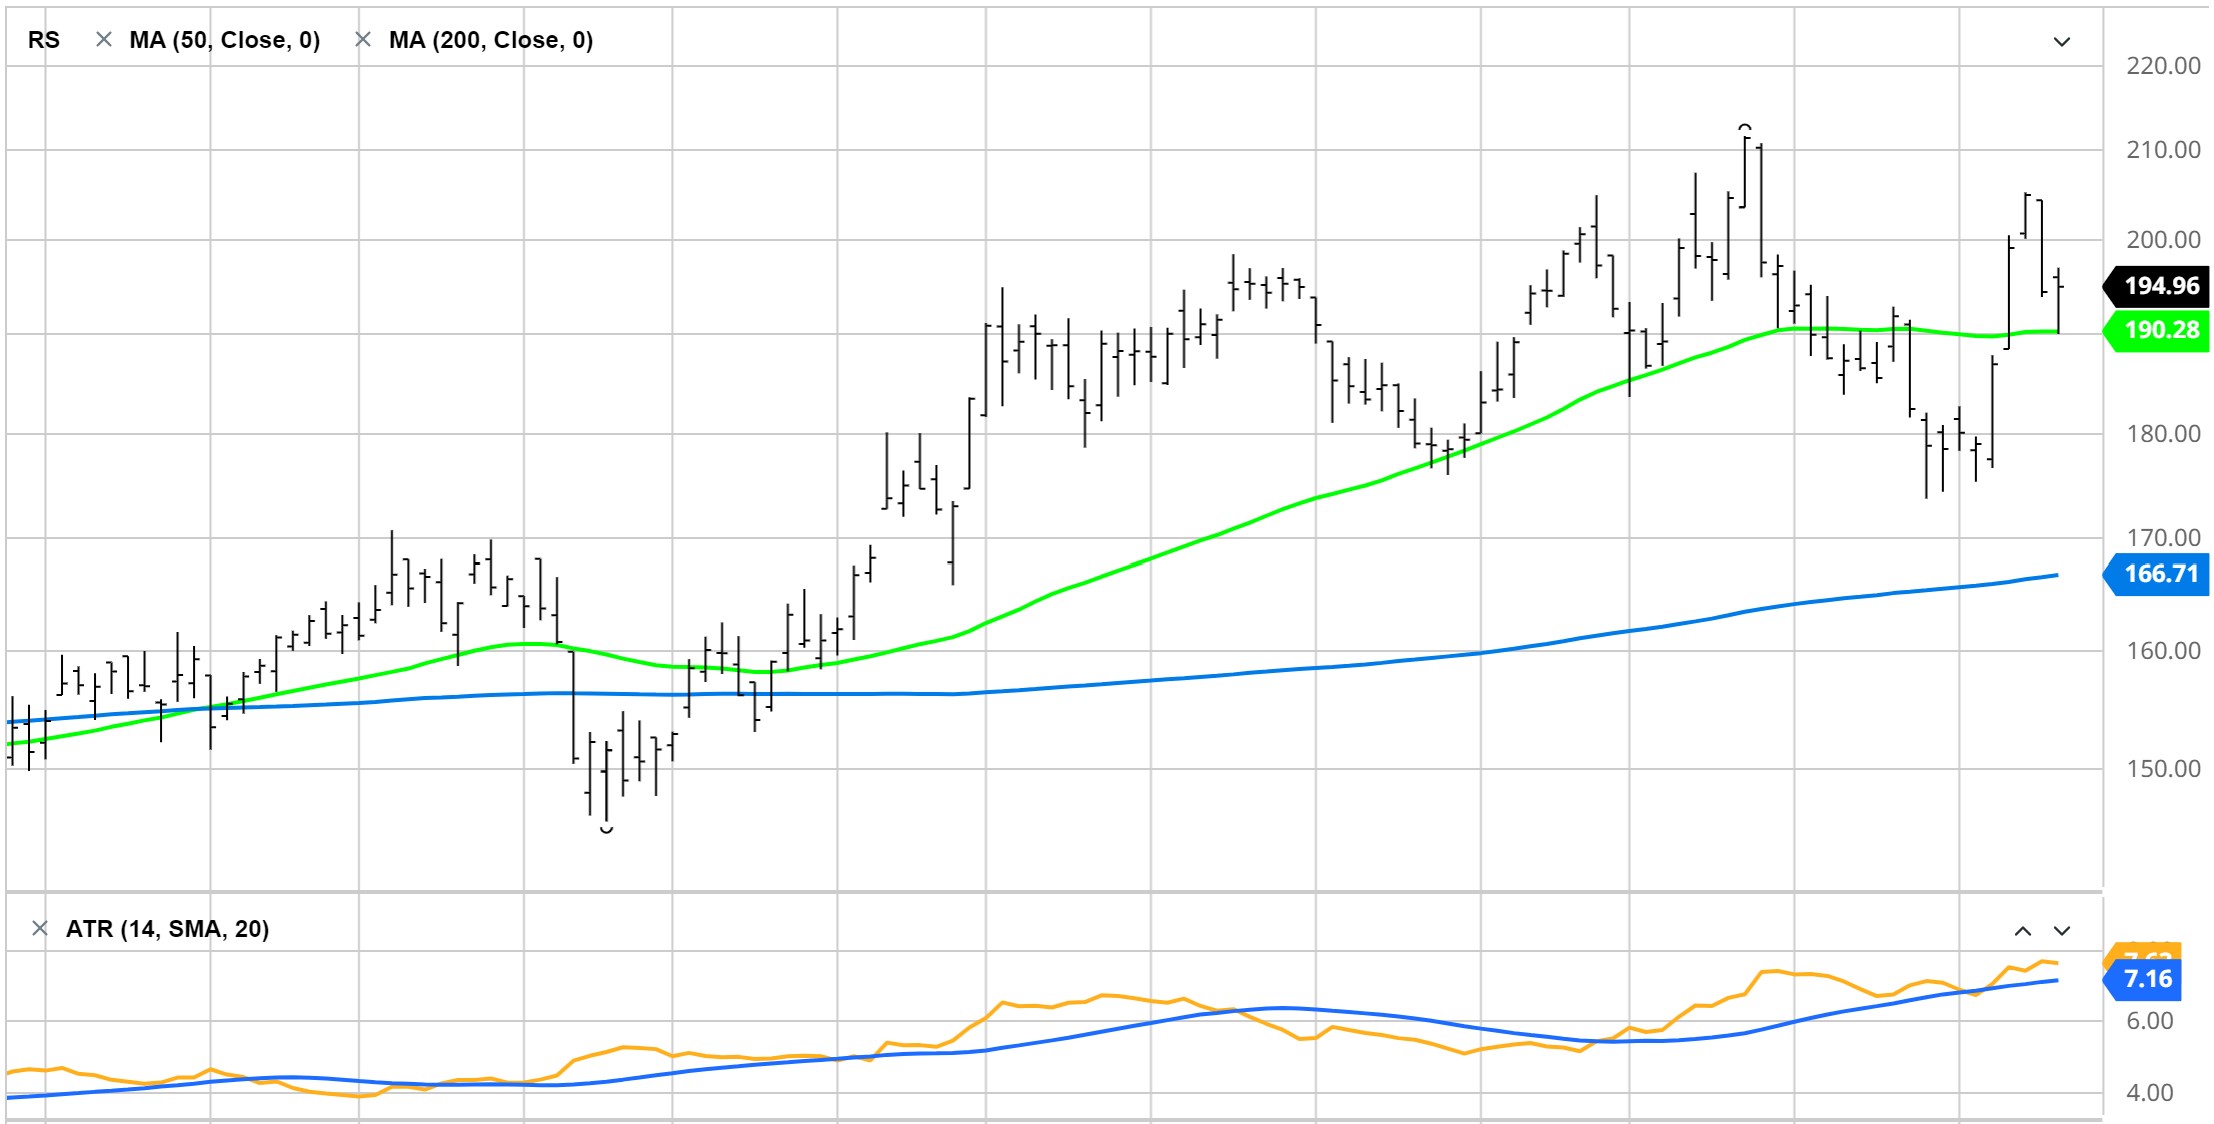
Reliance Steel & Aluminum (RS) – Shares Purchased
I allocated 4.4% of my account RS.
I now hold four stocks (TRGP, MNRL, VICI, RS) and all have open profits.
Brigham Minerals (MNRL) – Changed Stop
I have a 13.9% open profit on MNRL after just 9 days so I changed the 8% trailing stop to a Sell on Stop order with a stop price of $29.55. MNRL closed today at $30.80.
June 02
Brigham Minerals (MNRL) – Raised Sell Stop
The price of MNRL shares rose $0.68 today closing at $31.48 giving me an open profit of 16.5% in 10 days. As one of my golden rules is to never allow a substantial profit to turn into a loss, I rose my sell stop to $30.50.
Stock Selection Strategy Results
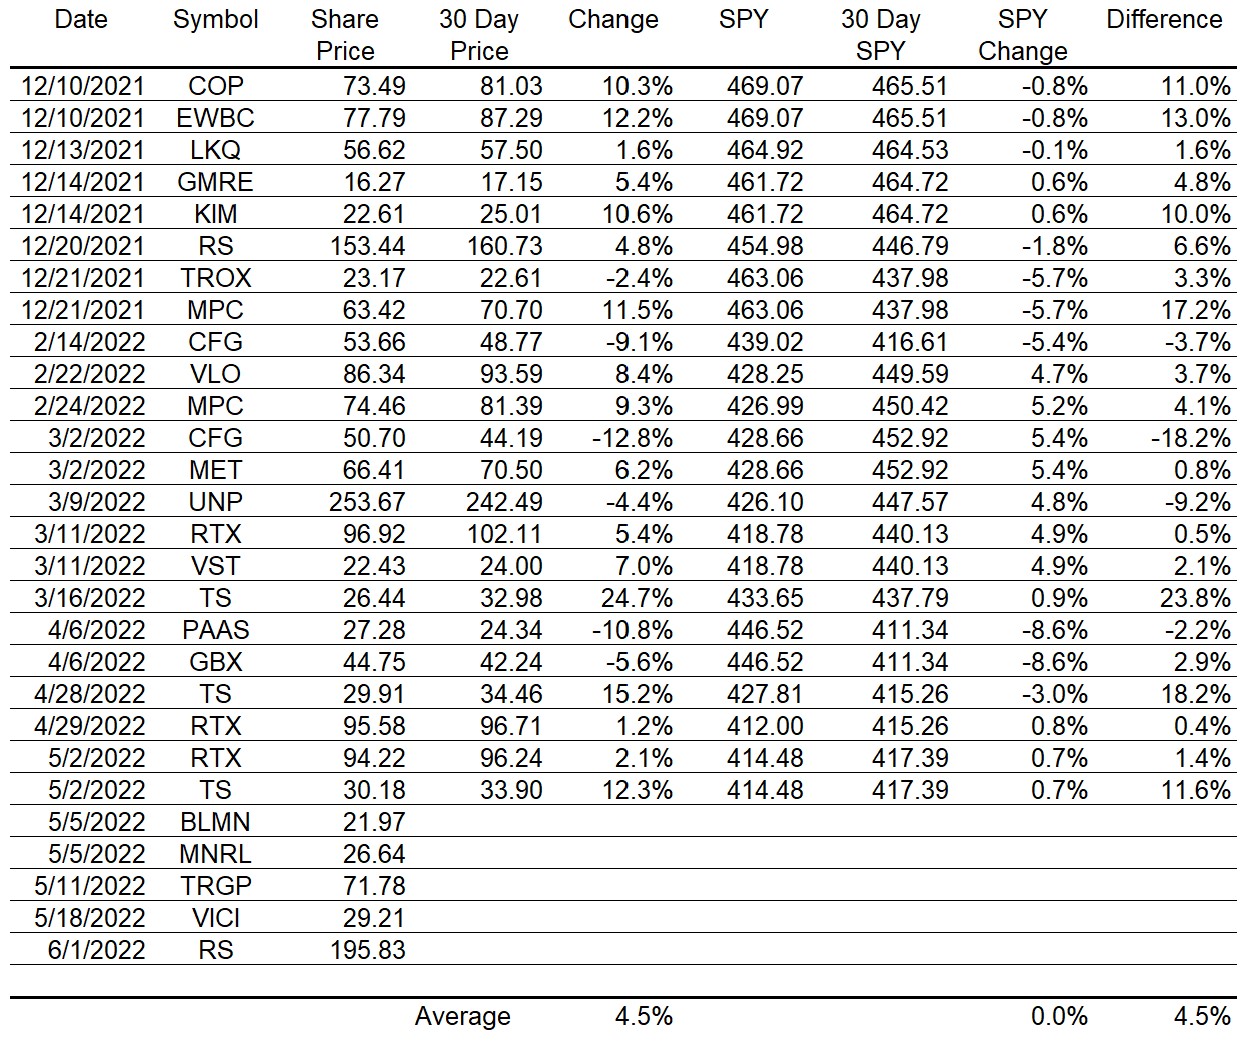
I have been working over the past year to improve my stock selection strategy and have settled on the current version which produced the stock selections listed in the table below. Two things are striking: 1. there weren’t a lot of stocks selected over the past six months and 2. the performance of the stocks selected is very strong over a 30-day period. The S&P 500 is down roughly 8% over the past six months so it hasn’t been a good time for stock performance and, thus, a small number of stocks selected for purchase over that period is expected.
The four stocks I currently hold were all chosen based on the strategy that produced the stocks in the table.
Account Risk
I haven’t mentioned account risk before but it is something that I monitor and you should as well if you are an active investor. A typical range of acceptable account risk is 1.5% to 2.5%.
Let’s look at an example of how I calculate account risk using the four stocks I currently hold in a hypothetical $100,000 portfolio.
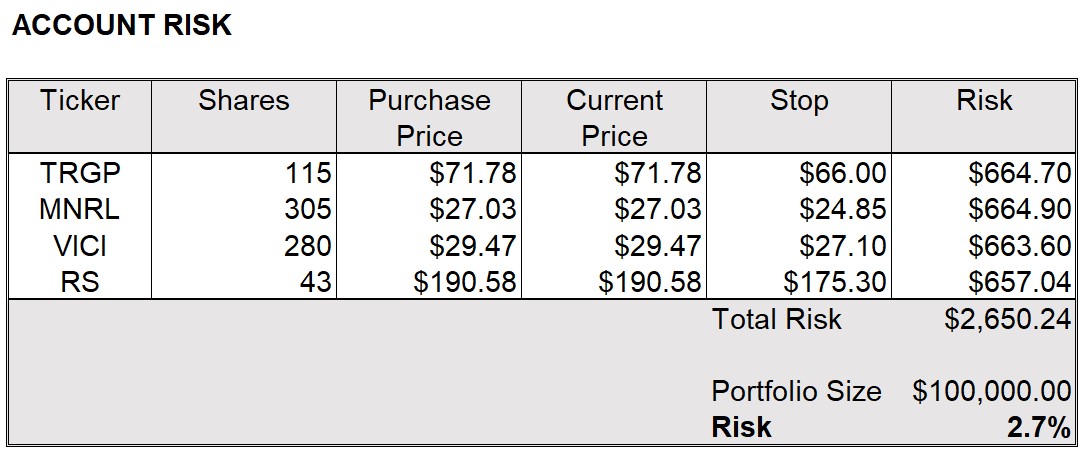
For the purposes of calculating account risk, I define risk as a potential loss when a stock is sold for less than the purchase price. In the above table, I have assumed that the four stocks were all purchased simultaneously and the table was produced immediately after the purchase. That explains why the current price is the same as the purchase price.
The risk for each stock is based on the following formula:
Risk = Number of Shares x (Stop – Purchase Price)
In the table, I have set the Sell Stops at 8% below the purchase price. 8% is generally the highest percentage loss that I am willing to accept and often I set an 8% trailing stop immediately after purchasing a stock.
As you can see in the lower right corner, the total risk is 2.7% of the portfolio value which, for me, is unacceptably high.
Now let’s look at my actual stops for the four stocks currently in my portfolio.
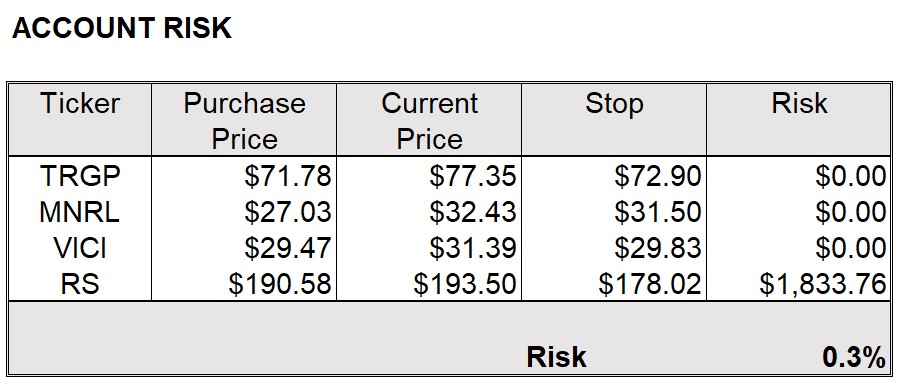
How is it that I show no risk for three of my stocks? If you compare the stop prices for those three to the purchase prices you will realize that I have the stops higher than the purchase price. If the prices for those three stocks dropped and the stocks were sold at the stop prices, I would have profits on all three so I consider those to be trades in which there is no risk of loss where loss is defined as selling a stock for less than the purchase price. Of course, there could be a massive selloff in the markets and the stocks could gap down below the stop prices. That’s highly unlikely but certainly not impossible.
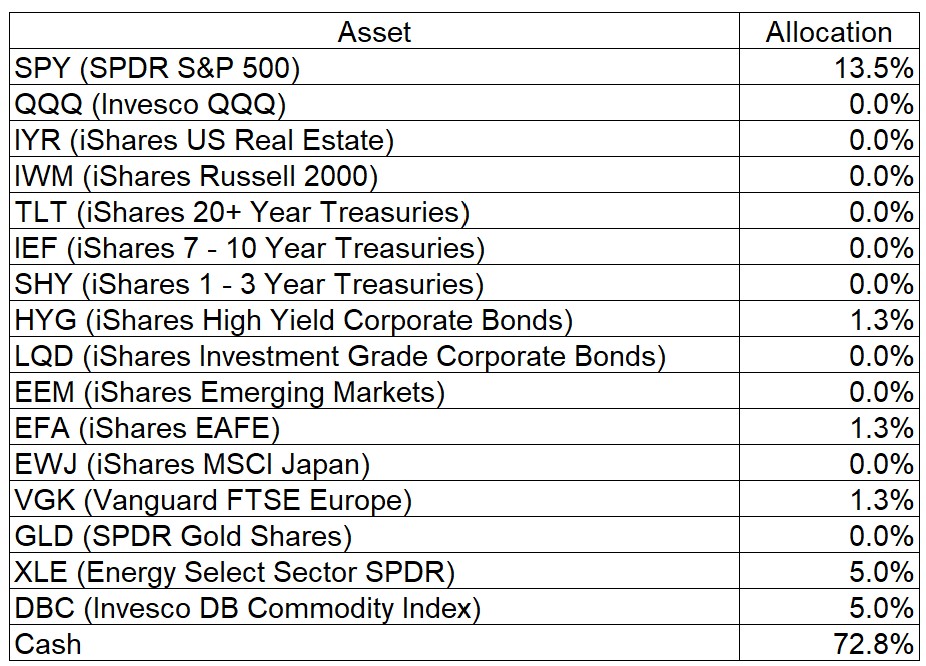
Asset Class Allocations for ETF Investing
There was a slight reduction in the cash allocation this week as there were new allocations to EFA and VGK.
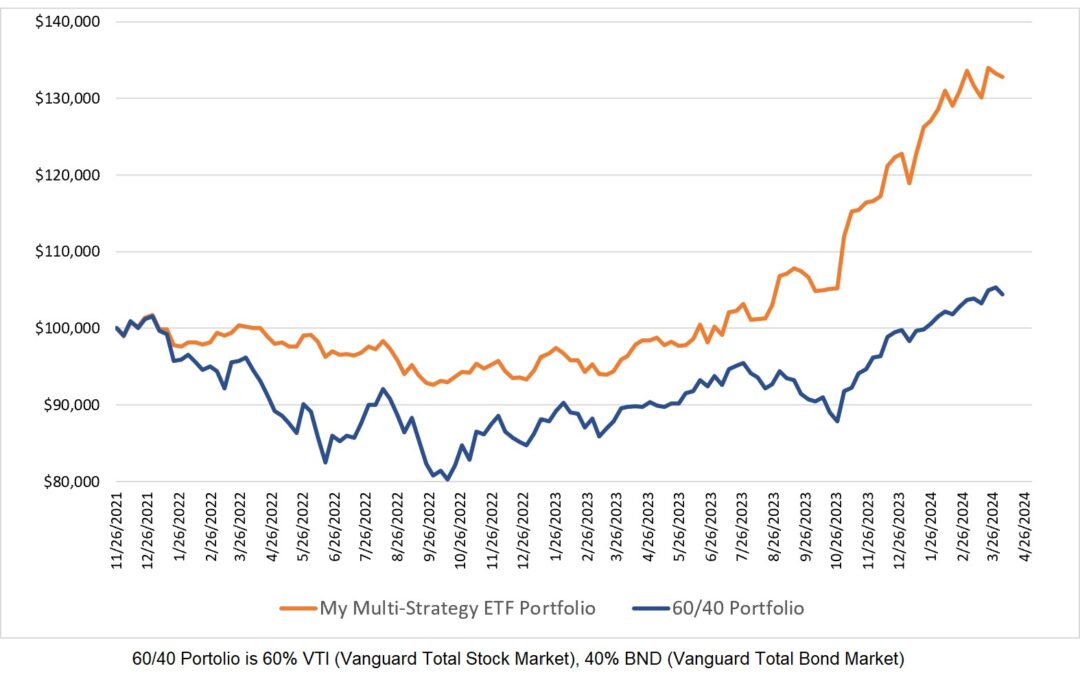
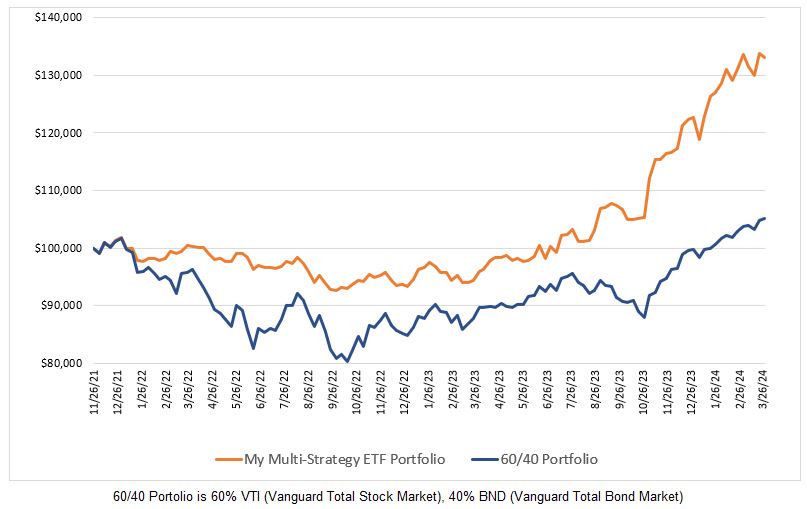
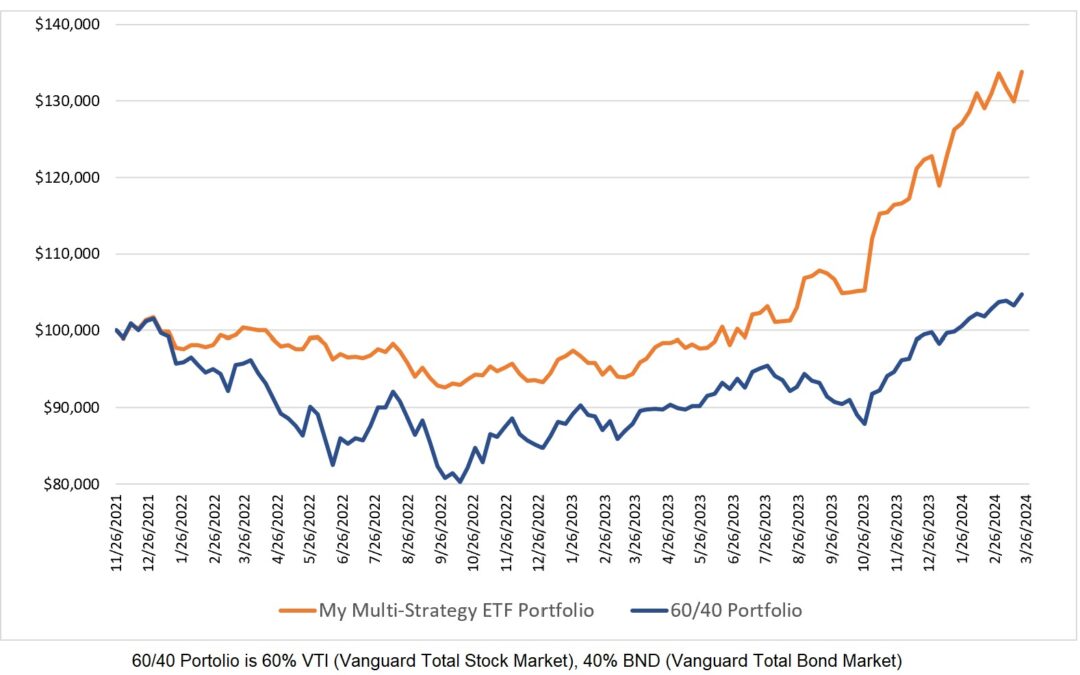
I began including the Asset Class Allocation table in my posts last November. The chart below illustrates how following my asset class allocations has performed versus a 60/40 (60% VTI, 40% BND) portfolio.
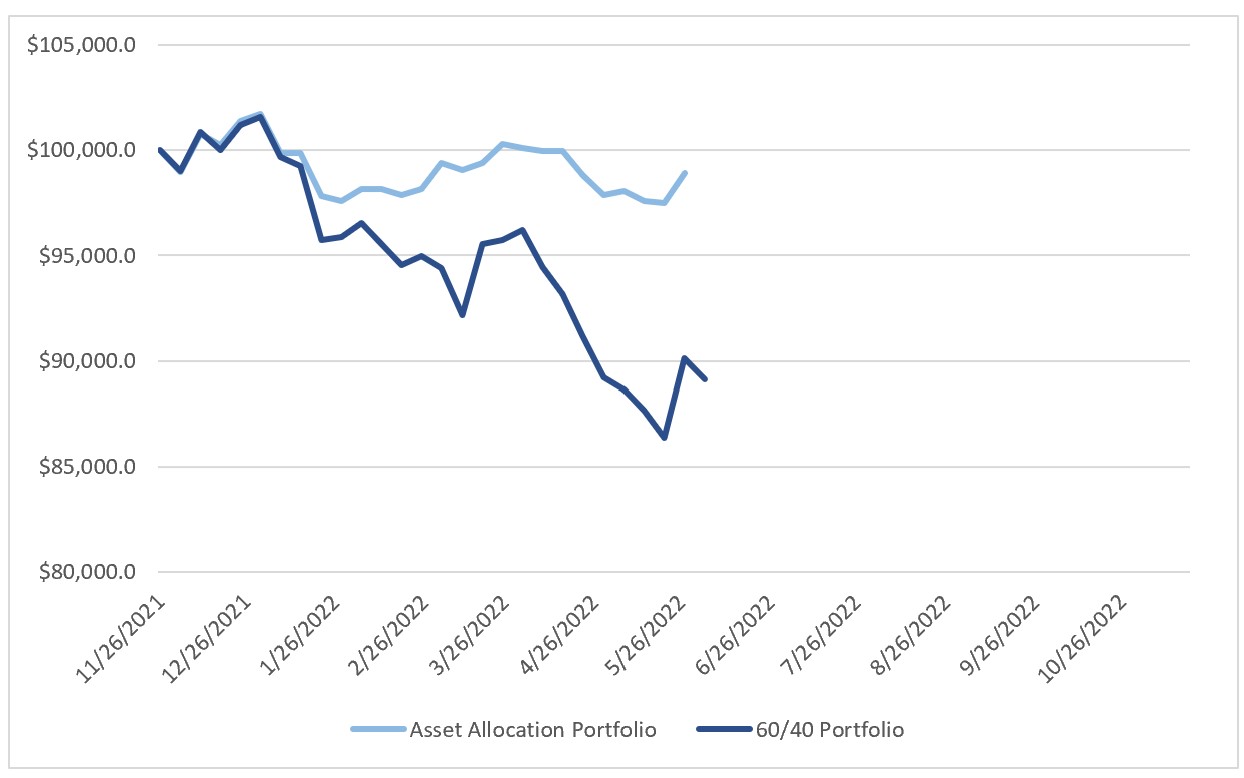
Yes, my asset allocation model has outperformed but it is over a meaningless short period of time. For those readers not fully acquainted with asset class allocation models, the goal isn’t necessarily to outperform a 60/40 portfolio but rather to minimize drawdowns while experiencing similar or better returns over a long period of time.
Open Trades
My current open stock trades can always be viewed here.
0 Comments