
If you perform an internet search on how to calculate expectancy as it relates to trading systems, you will most often see the following:
Expectancy = (probability of win x average win) + (probability of loss x average loss)
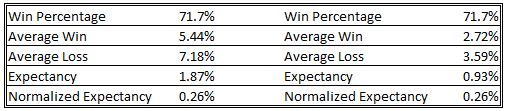
The average win and average loss can be either percent gain or loss or it can be dollar values. For example, following are the performance statistics for one of my trading strategies:
- Probability of win = 71.7%
- Average win = 2.72%
- Probability of loss = 28.3%
- Average loss = -3.59%
I can calculate the expectancy in percentage terms as follows:
Expectancy = (0.717 x 0.0272) + (0.283 x -0.0359) = 0.93%
The above calculation appears to be by far the most common used by traders. However, after reading Kevin Davey’s article on the Futures Magazine site, I engaged Kevin in an offline conversation about the expectancy calculation. In his article, Kevin presents a means of normalizing the expectancy by dividing the result in the formula above by the average loss.
Normalized Expectancy = [(probability of win x average win) + (probability of loss x average loss)]/absolute value of average loss
For my trading system discussed above, the normalized expectancy is 0.93% / 3.59 = 0.26%. At this point, one has to wonder what is the benefit, if any, of normalizing the expectancy. Let’s consider two very simple equity curves.
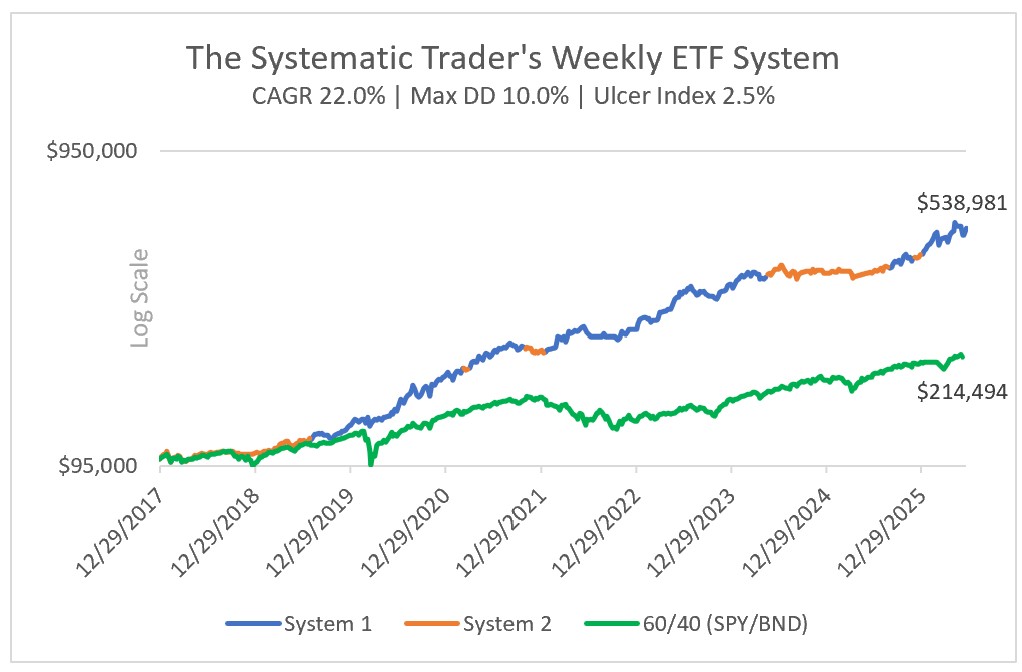
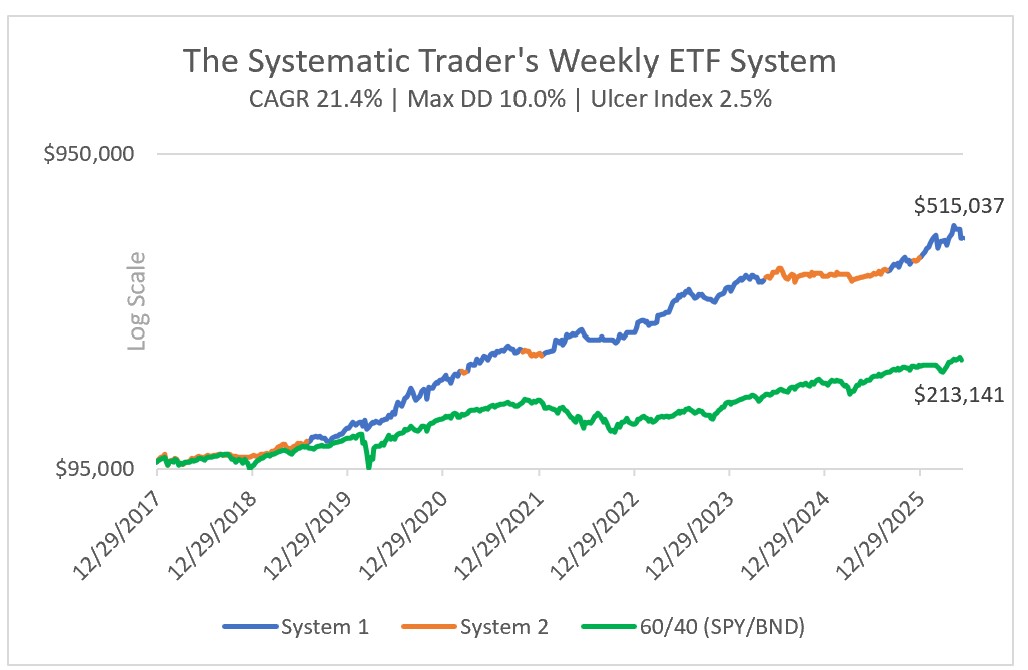
Which of the two equity curves on the chart below appeal most to you?
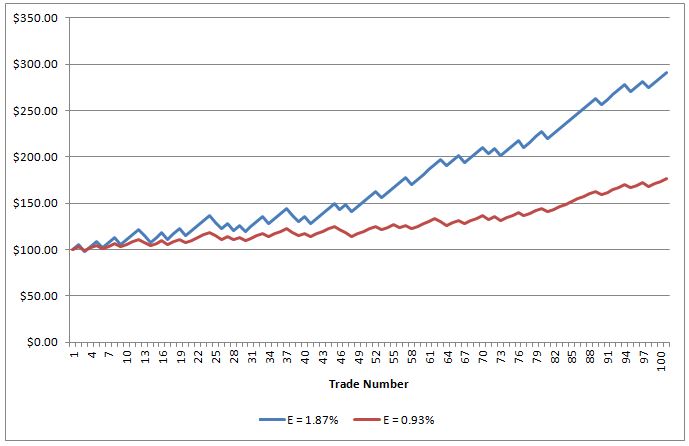
Both systems denoted in the chart above have the same normalized expectancy but the expectancy of the system with the blue equity curve is double that of the system with the red equity curve.
I suspect most traders would choose the system with the higher expectancy with all other things being equal. If, for means of calculating compound annual growth rate, gain per day, and Calmar Ratio, we assume that the trades for these two systems occur at the beginning of consecutive months we will find that the system with the higher expectancy in our example also has the higher Calmar Ratio and higher average percent gain per day. For me, the system denoted by the blue equity curve is the preferred system to trade. In this example, the normalized expectancy indicates that both systems are equal but I don’t agree with that. Therefore, the normalized expectancy was of no value to me in comparing the two systems. Does that mean normalized expectancy never points a trader towards a superior system? Stay tuned.
0 Comments