
In 1996, Lars Kestner wrote an article titled “Measuring System Performance” for Stocks and Commodities magazine that introduced a new ratio to compare the performance of various trading strategies. This new ratio, which he named the k-ratio, was focused on consistency of returns over time and could be applied to daily, weekly or monthly data. The k-ratio provides higher values for systems that produced higher returns with less deviation from a least-squares regression line of the equity curve. A good overview of the k-ratio is provided by Zephyr Associates who, for incomprehensible reasons, decided that it would provide clarity if they renamed the original version of the k-ratio as the Zephyr k-ratio. I guess the name k-ratio (1996) didn’t occur to them.
As the Zephyr article provides an overview of the k-ratio, there is no need of me providing same in this post so I’ll leave it to you to read that article.
Kestner has since modified the k-ratio twice, once in 2003 and then again in 2013, so the three versions will be denoted here as k-ratio (1996), k-ratio (2003) and k-ratio (2013).
k-ratio (1996) = slope of least squares regression line of equity curve/ (standard error of slope x square root of number of observations)
Let’s look at how we calculate the k-ratio (1996) in Microsoft Excel.
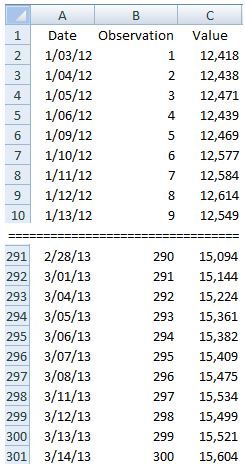
The figure above shows the first and last 10 entries in a table of 300 rows of entries. The slope of the least-squares regression line is SLOPE( C2:C301,B2:B301) and the standard error of the slope is STEYX(C2:C301,B2:B301)/SQRT(DEVSQ(B2:B301)). The k-ratio (1996) is therefore calculated in our Excel example as:
k-ratio = (SLOPE(C2:C301,B2:B301)*SQRT(DEVSQ(B2:B301))/(STEYX(C2:C301,B2:B301)*SQRT(300))
In 2002, Kestner noted that in mid-2000 trader Bob Fuchs brought a small error to his attention regarding the scaling of the k-ratio. In his 2003 book “Quantitative Trading Strategies”, Kestner changed the factor denominator from square root of number of observations to number of observations. The net effect of this change was that the 2003 version of the k-ratio was smaller than the 1996 version by the square root of the number of observations.
![]()
The Excel formula for our example is
k-ratio = (SLOPE(C2:C301,B2:B301)*SQRT(DEVSQ(B2:B301))/STEYX(C2:C301,B2:B301)/(B301)
Recently, Kestner published an article titled “(Re)Introducing the K-Ratio” in which he made another modification to the k-ratio in order to make the ratio consistent when comparing equity curves of different time frames (e.g. daily versus monthly). The paper is freely available on SSRN by clicking here.
k-ratio (2013) = (slope of least-squares regression line / standard error of slope) x (square root of number of observations per calendar year / number of observations)
The number of observations in a year is 4 for quarterly data, 12 for monthly data and 252 for daily data.
For our example:
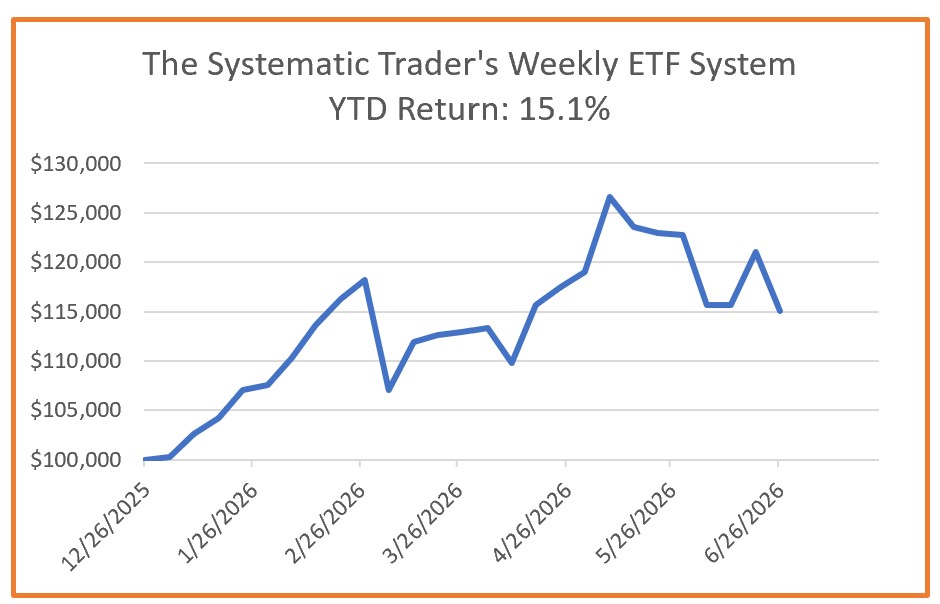
k-ratio (2013) = (slope of regression line / standard error of slope) x ((square root of 252) / 300) =1.51
The EXCEL formula is:
k-ratio = (SLOPE(C2:C301,B2:B301)*SQRT(DEVSQ(B2:B301))/(STEYX(C2:C301,B2:B301))*(SQRT(252)/300)
The following figure is the equity chart for our example.
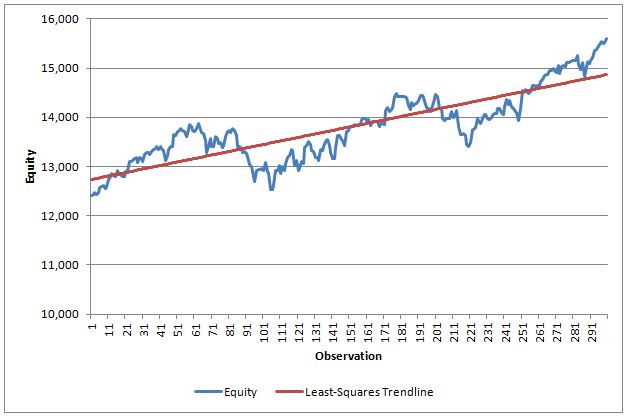
For this equity chart, the three k-ratio values are:
k-ratio (1996) = 1.65
k-ratio (2003) = 0.0953
k-ratio (2013) = 1.51
The three versions of the k-ratio are:

The absolute value of the k-ratio is really of little interest other than we want it to be positive and bigger is better. The merit of the k-ratio is the ability it provides to compare equity curves for consistency of returns.
If you are an AmiBroker user, you will likely correctly guess that it uses the 2003 version. The AmiBroker support staff has confirmed that the change from the 1996 version to the 2003 version took place with AmiBroker v4.56.1. The developer of StrataSearch has advised me that his software still uses the 1996 version of the k-ratio.
I realize that this post isn’t your typical easy read but I do believe the k-ratio is a very good objective function that traders should consider when evaluating trading strategies.
FJP
0 Comments