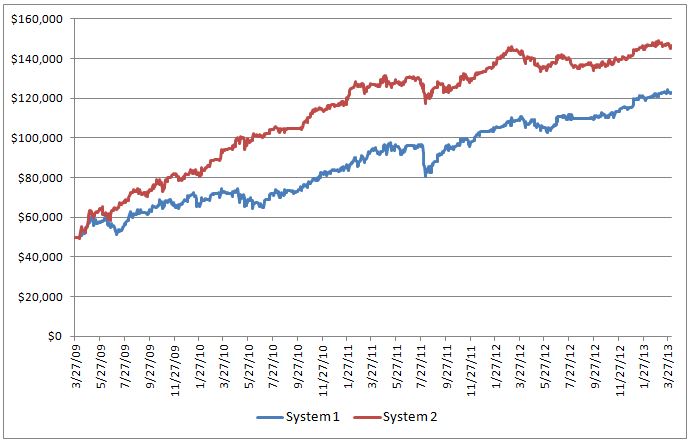
Below are the back tested results for two of the mean reversion strategies that I use:

As both the expectancy and normalized expectancy values are very similar, one might expect similar portfolio growth from the two systems. Alas, it isn’t so.

How can System 1 with virtually the same expectancy as System 2 provide a higher return? The answer has everything to do with the number of trades. Consider two systems with identical expectancies but one system provides four trades per month and the other system provides only one trade per month. The first system will be far more profitable and that is what is behind the difference in performance for the two systems above. System 1 had 32% more trades over the same time period as System 2. Therein lies an issue when comparing trading systems based on expectancy – you also have to know how many trades are generated.
For those who like formulas, the relationship between account growth, expectancy and frequency of trades can be expressed as:
FV = IV x (1 + e)n
FV = account value at end of year
IV = initial account value
e = expectancy
n = number of trades per year
This formula would apply to a system that would only have one trade open at a time and invests the full account in every trade. For an example, let’s consider a trading system that has an expectancy of 1.3% and trades 12 times per year. If the initial account value is $10,000 then the account value at the end of the year is determined as follows:
FV = $10,000 x (1 + 0.013)12 = $16,765
If the number of trades per year can be increased to 18 for the same expectancy, the final account value would be $26,174. Clearly, expectancy isn’t all that helpful as a performance statistic without consideration of the frequency of trades.
Just so you know, the Calmar Ratios for Systems 1 and 2 above are 1.37 and 2.98 respectively. Likewise, the daily returns were 0.84% and 1.0%. In this case, daily returns are calculated based on the number of trading days a position is held (i.e. weekends and holidays aren’t included).


0 Comments