
I decided to spend some free time to prepare an Excel spreadsheet so I could calculate Jensen’s alpha for my trading performance. The basis of my work is the spreadsheet found here.
Jensen’s alpha was developed by Michael Jensen and originally presented in a 1967 paper which was published in the Journal of Finance. Jensen is currently an Emeritus Professor of Business Administration at Harvard.
Simply stated, Jensen’s alpha is calculated as:
Jensen’s alpha = Portfolio Return − (Risk Free Rate + Portfolio Beta * (Market Return − Risk Free Rate))
As per the relevant Wikipedia article, alpha is the excess return of a security or portfolio of securities over the theoretical expected return. There are many articles you can easily find which discuss Jensen’s alpha so I won’t go into a detailed discussion of alpha in this post. For me, a positive alpha indicates my trading system performed better than was expected based on the risk I took with my account as measured by my account’s beta. The key point is that one wants alpha to be positive and bigger is better.
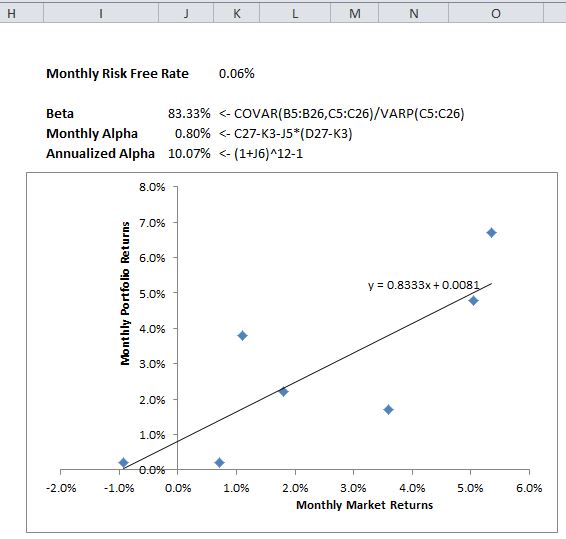
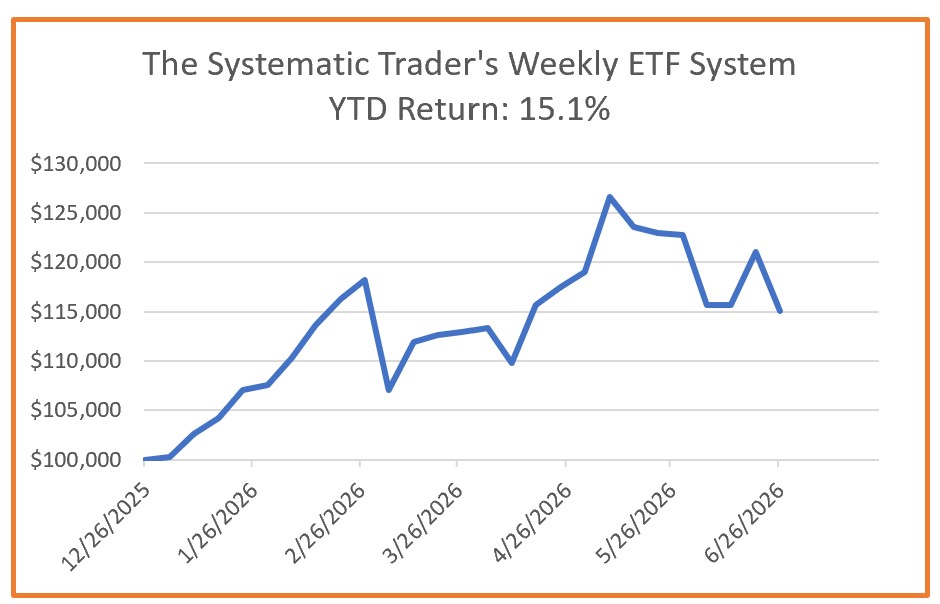
The table and chart below show how I have the Excel spreadsheet set up.
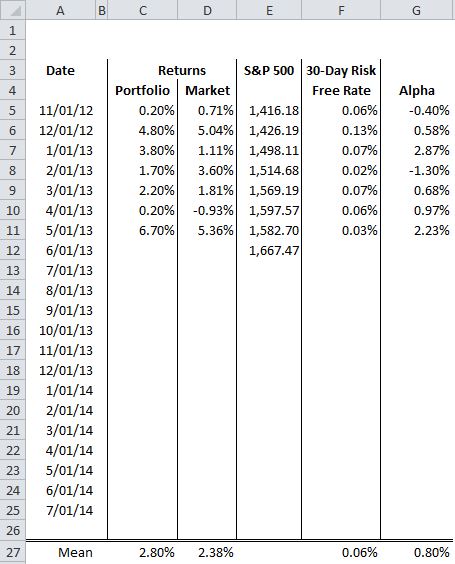
My source for risk-free rates is here.
Ideally, one would have at least 36 months of returns so a t-statistic test could be performed to determine if the hypothesis that alpha is positive could be proven with statistical significance.
The portfolio returns in the table above are for my trading system on Collective2.com.
0 Comments