There are no changes to my model portfolio this week as it continues to have a 100% allocation to EFA (iShares EAFE).
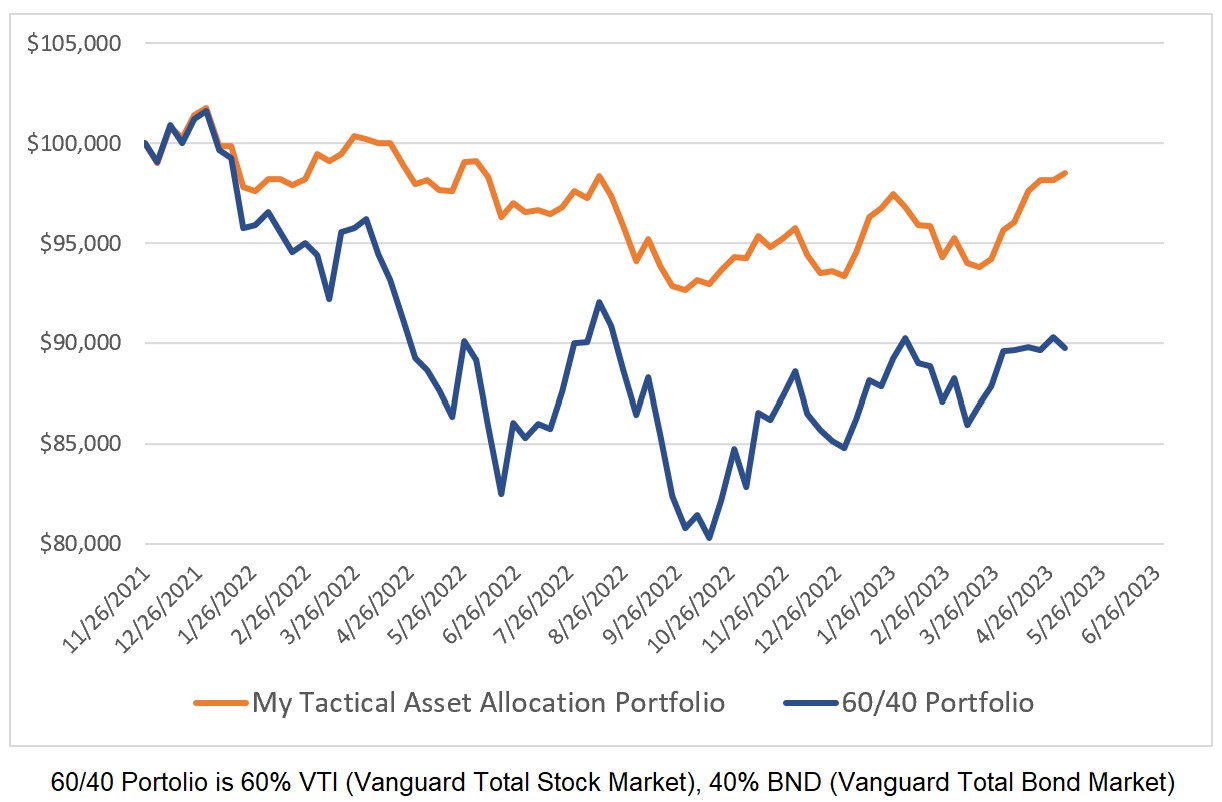
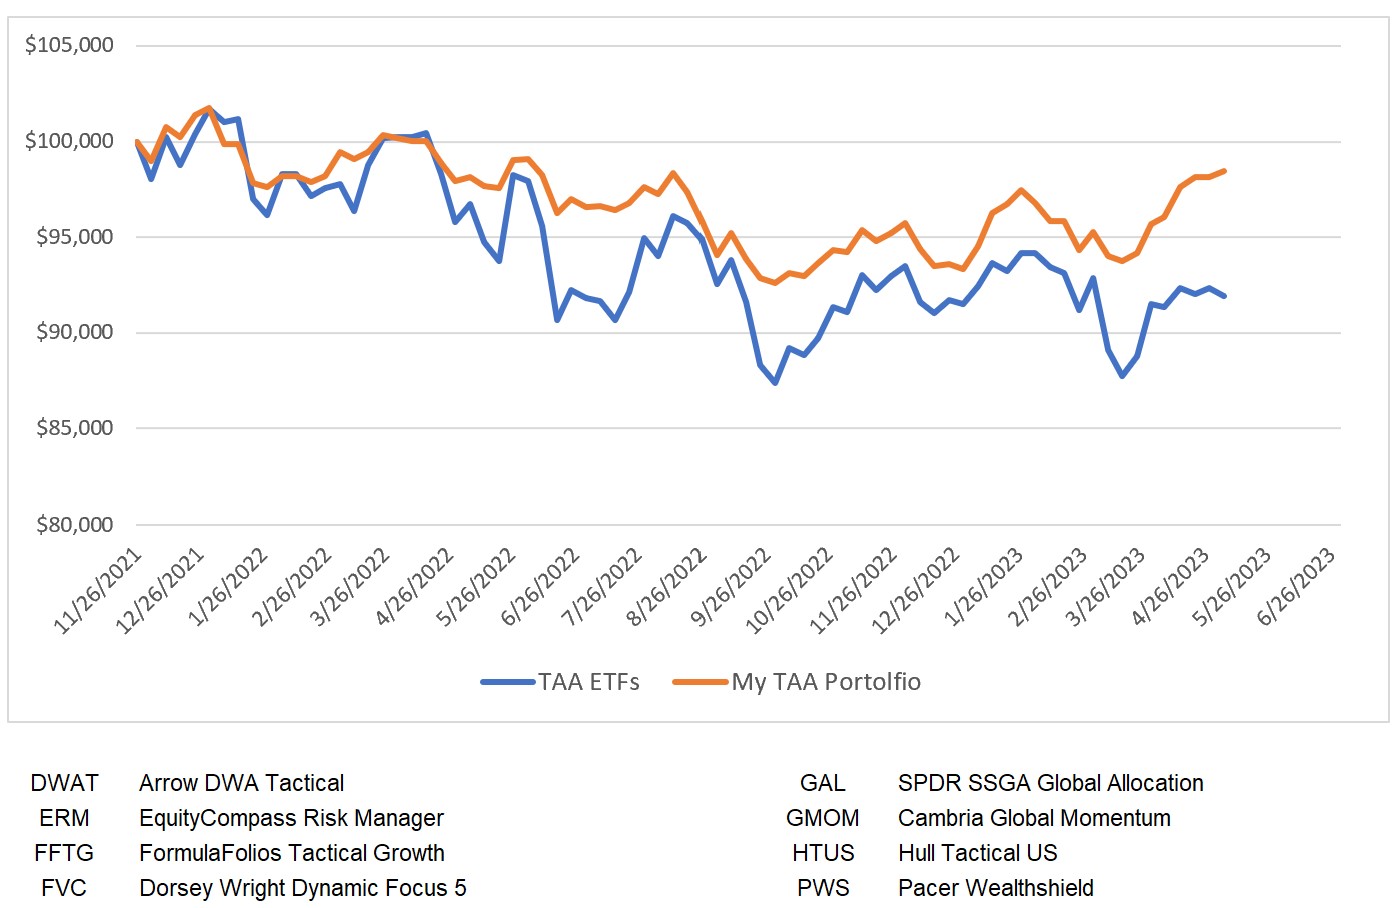
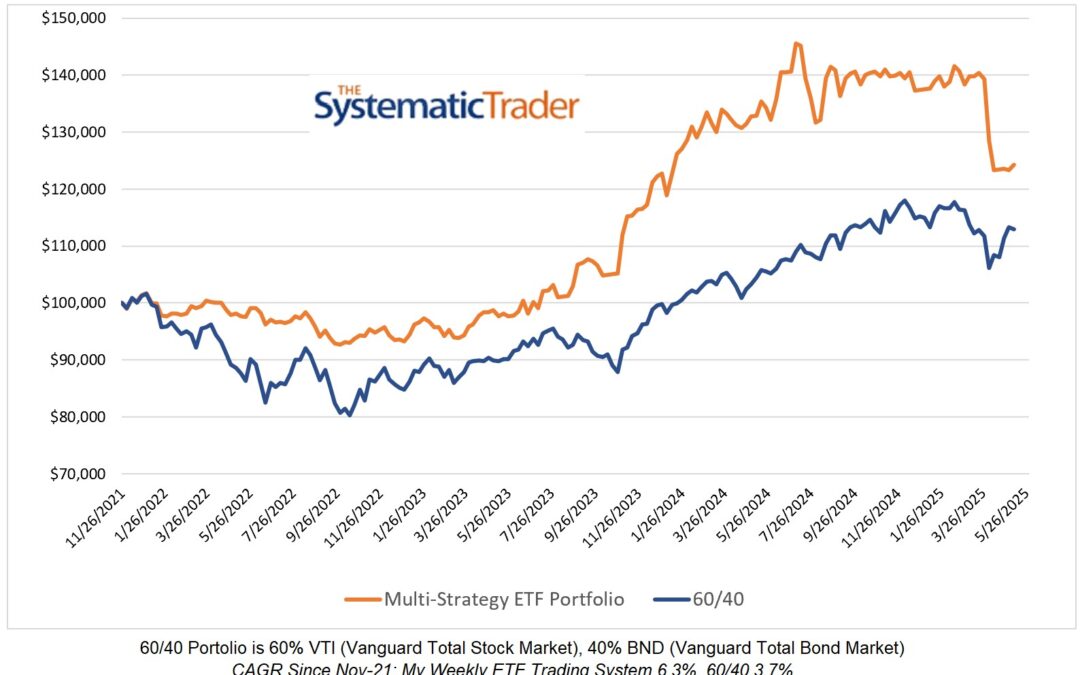
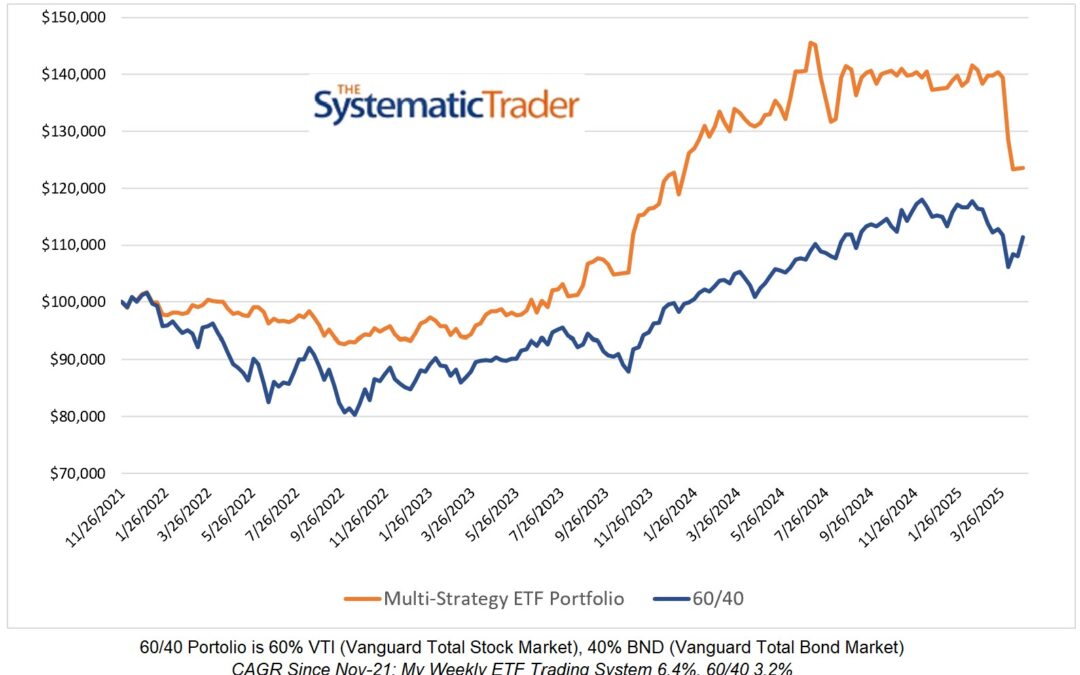
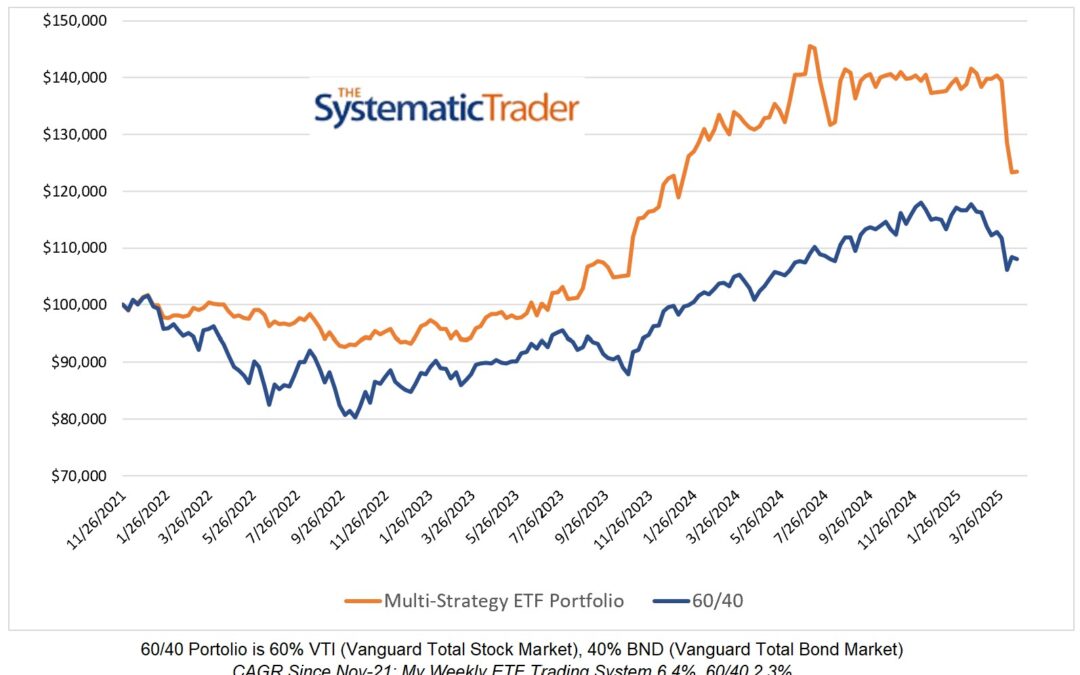
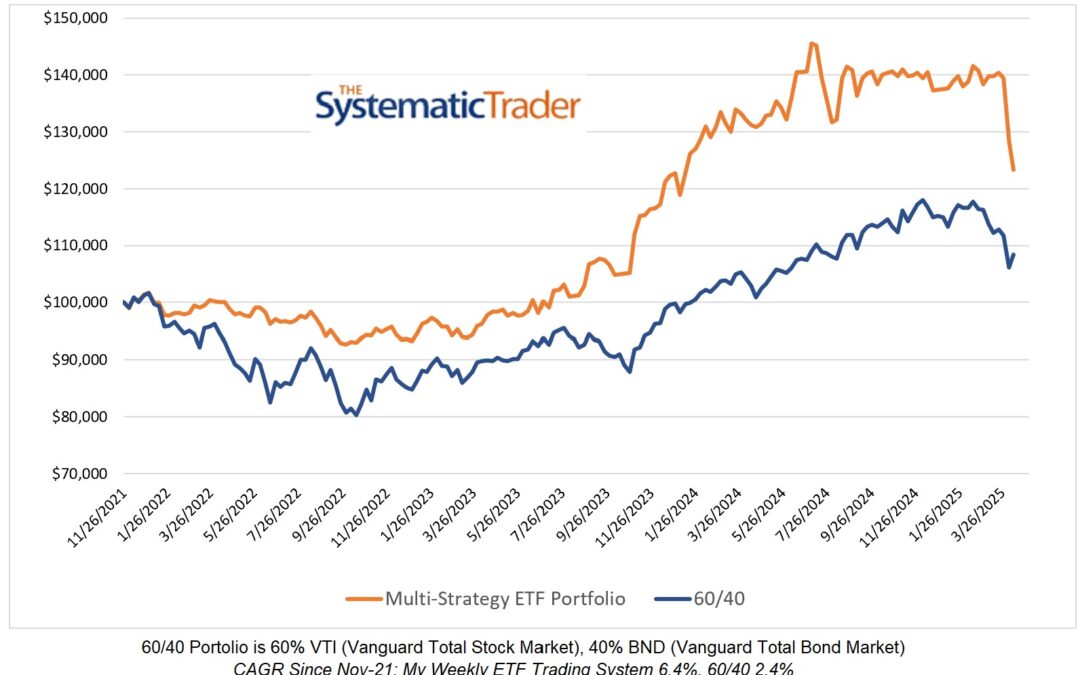
As you can see in the above chart, the allocations I post here weekly have consistently outperformed the beloved 60/40 portfolio. Is the outperformance simply a matter of tactical asset allocation or is it something else? The chart below illustrates that my weekly allocations have so far produced a better return-to-date versus an average of eight tactical asset allocation ETFs. The timeframe covered is relatively short so no long-term conclusions can be drawn. It is assuring, however, to know that thus far my weekly allocations are beating the combined performance of 8 ETFs that have approximately $743,000,000 assets under management in total. Additionally, my allocations have provided a smoother equity curve than the TAA ETFs. Better returns with less volatility is the goal of most investment strategies and I appear to be on the road to achieving that.
ETF Performance Over Previous 12 Months
The table below should illustrate to some degree why my models currently have no allocation to US equities. None of the US equity ETFs are the best performers in any of the four time periods.


0 Comments