The team at Gestaltu recently published two posts on their site regarding an upcoming paper titled “Tactical Alpha: A Quantitative Case for Active Asset Allocation”. Such a paper would be interesting to me as my ETF momentum strategy is based on active asset allocation. The first post discusses a means of evaluating the performance of active asset allocation strategies and provides an explanation for why the authors believe the appropriate means is to calculate alpha generated using a passive global index as the benchmark. This post describes how they arrive at the composition of a global passive index with ETF’s and factor tilt.
In their second post, the authors provide performance evaluations for eleven global tactical asset allocation products and seven global risk parity products. The global tactical asset allocation products delivered an average of -1.43% alpha and the global risk parity products delivered an average of 1.51% alpha. Keep in mind that alpha was calculated based on a global ETF benchmark comprised as per the table below.
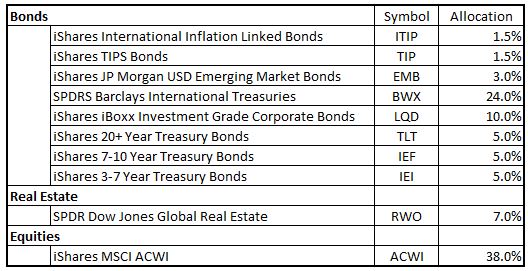 Next up for me is to calculate alpha for my ETF momentum strategy using the same passive global benchmark. In this post, I describe how to calculate Jensen’s alpha in Excel.
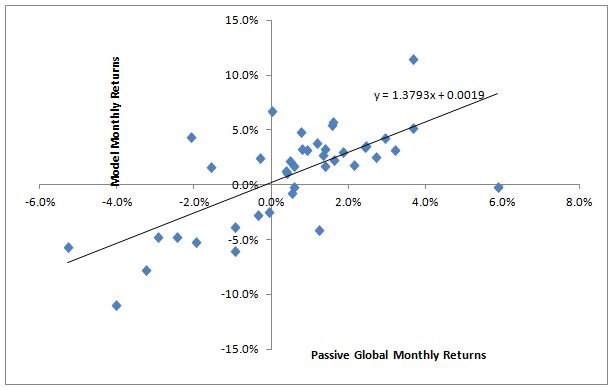
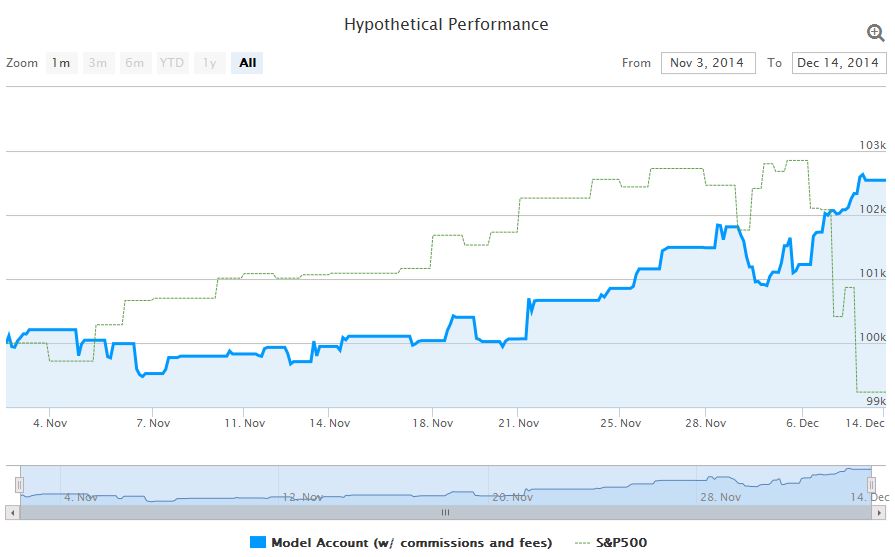
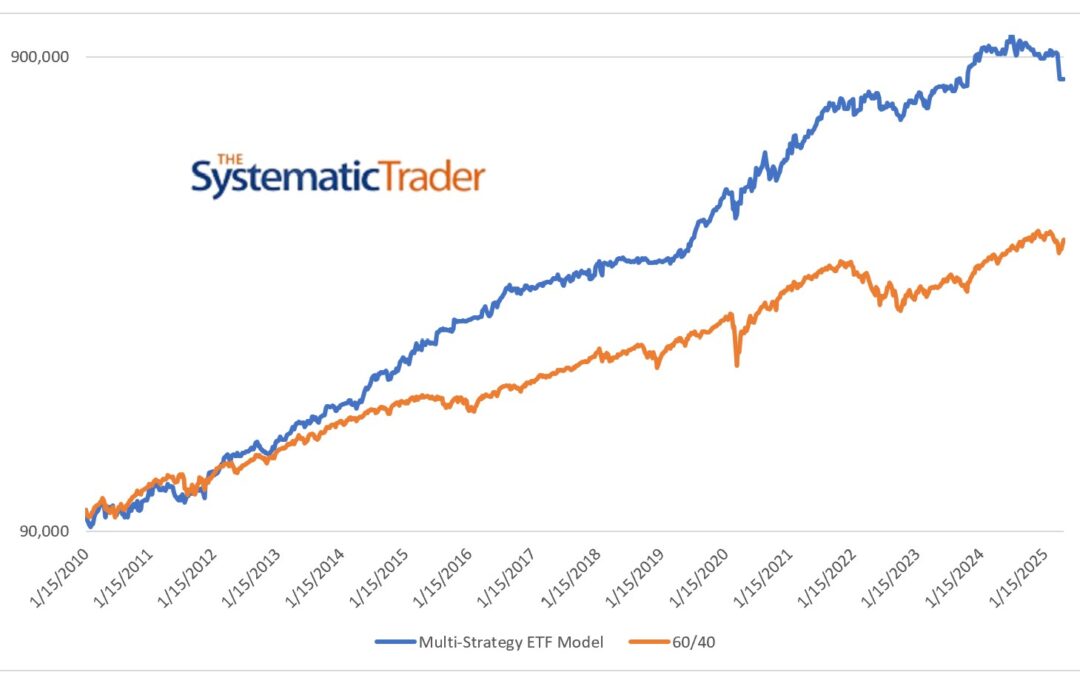
The good news is that my model generated an annual alpha of 2.52%. It has to be kept in mind, however, that my model performance results are really a backtest – actual trading started at the beginning of November and is being tracked on Collective2 under the name “Pure Momentum”. The chart below illustrates the performance of my live trading versus the S&P 500 so far.
 The caveat with the analysis done here and by Gestaltu is that the evaluation period is rather short but there is no getting around that as the active asset allocation products are relatively new. I do take comfort in learning that my model generated a higher alpha than 14 of the 18 products Gestaltu evaluated.


0 Comments